New maps from NOAA’s Climate Prediction Center (CPC) reveal who could see more snowfall during strong El Niño this Winter (January thru March, 2024 only), per CNN meteorologist, Mary Gilbert…
Sidney Sperry 06 Nov 2023 15:02 UTC
All,

Thought I’d share this article and graphics with you. Note that this is NOT a “forecast;” rather, NOAA scientists at its Climate Prediction Center (CPC) have analyzed data from El Niño winters occurring from 1953 through 2023 and compared them with data from the 1991 to 2020 (30 year) average.  These latest maps show areas of the U.S. that are more likely to receive more snowfall than the 30-year average, due to this year’s predicted strong El Niño winter. Increases from 1” up to several inches in some areas.
>
>
>
From CNN Meteorologist, Mary Gilbert - November 3, 2023

     El Niño - a natural ocean and weather pattern in the tropical Pacific - is forecast to reach the most significant level since a very strong El Niño in 2015-2016 fostered the warmest winter on record across the contiguous U.S., according to NOAA.
     While no two El Niño winters are the same, the pattern typically brings wetter and cooler weather to the southern U.S. while the north becomes drier and warmer. And that’s exactly what’s expected this winter.
     However, wetter weather doesn’t necessarily mean more snow. And, when it does snow, amounts can vary wildly from one location to the next.
     This is where the new maps come in. They show where snow is more or less likely during El Niño winters compared to average.
     There’s just one caveat: these maps are historical guidebooks, not forecasts, for how the season’s snow could play out. An actual snowfall forecast would account for a variety of atmospheric and climatological factors, not just El Niño.
     “El Nino nudges the odds in favor of certain outcomes, but never ensures them,” Michelle L’Heureux, one of the two scientists behind the new maps, explained in a NOAA blog post.
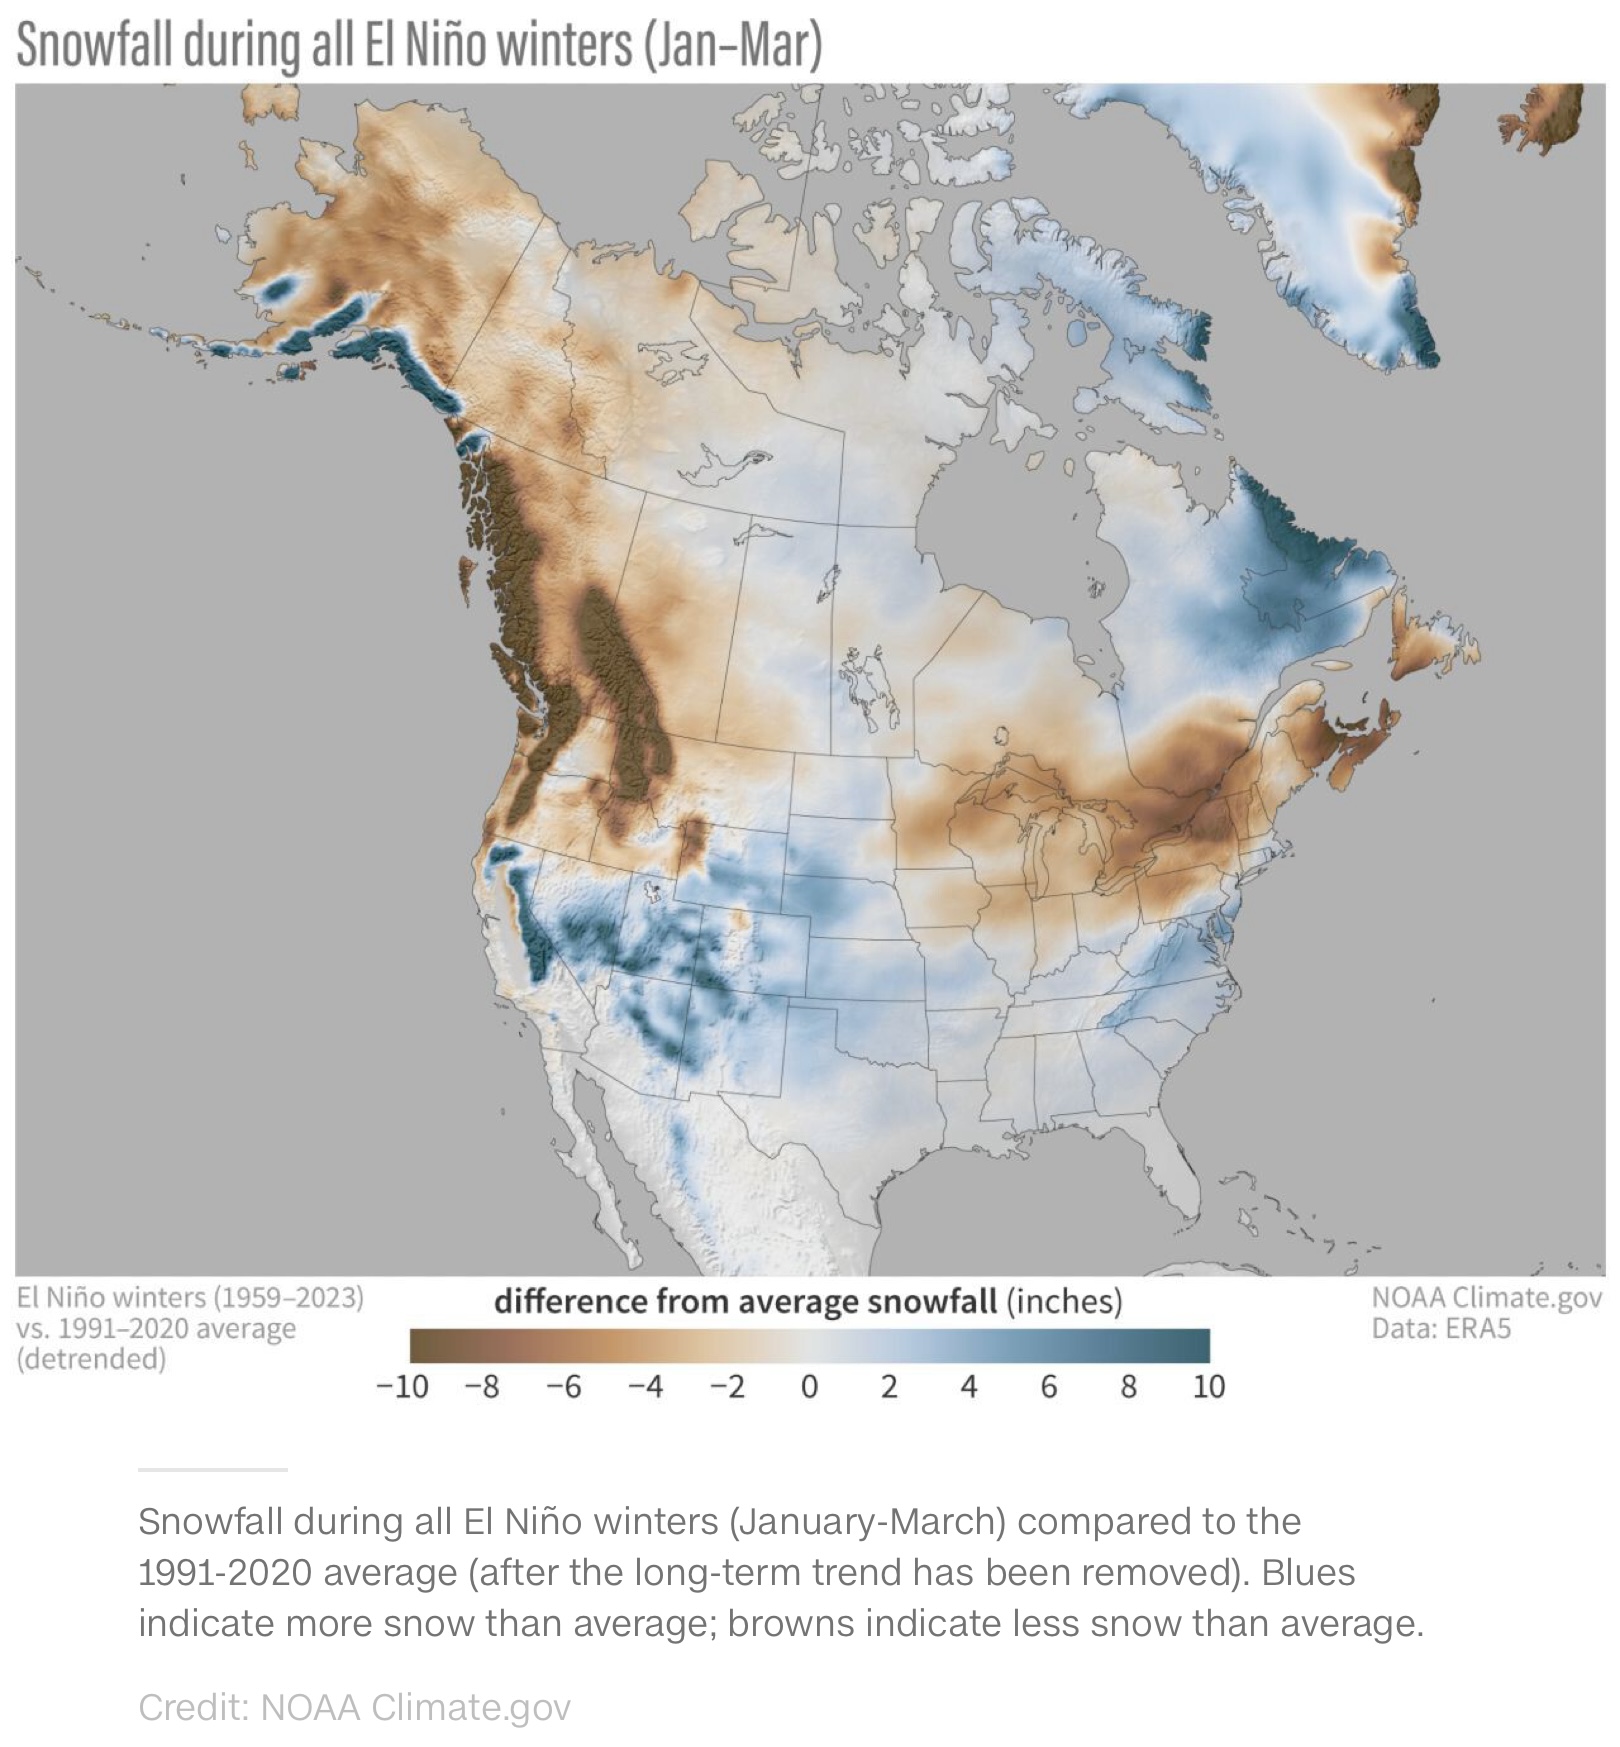
The map above depicts how much snow differs from average across all El Niño winters, regardless of El Niño’s strength. The drier trend that’s typical across the northern U.S. shows up well in the tan and brown shading, while the wetter, snowier trend across the southern U.S. appears in the blue shading.
This pattern comes from the jet stream’s shift south, pushing storms across the southern tier of the country at the expense of the north. And an increase in storms during the winter means snow is more likely.
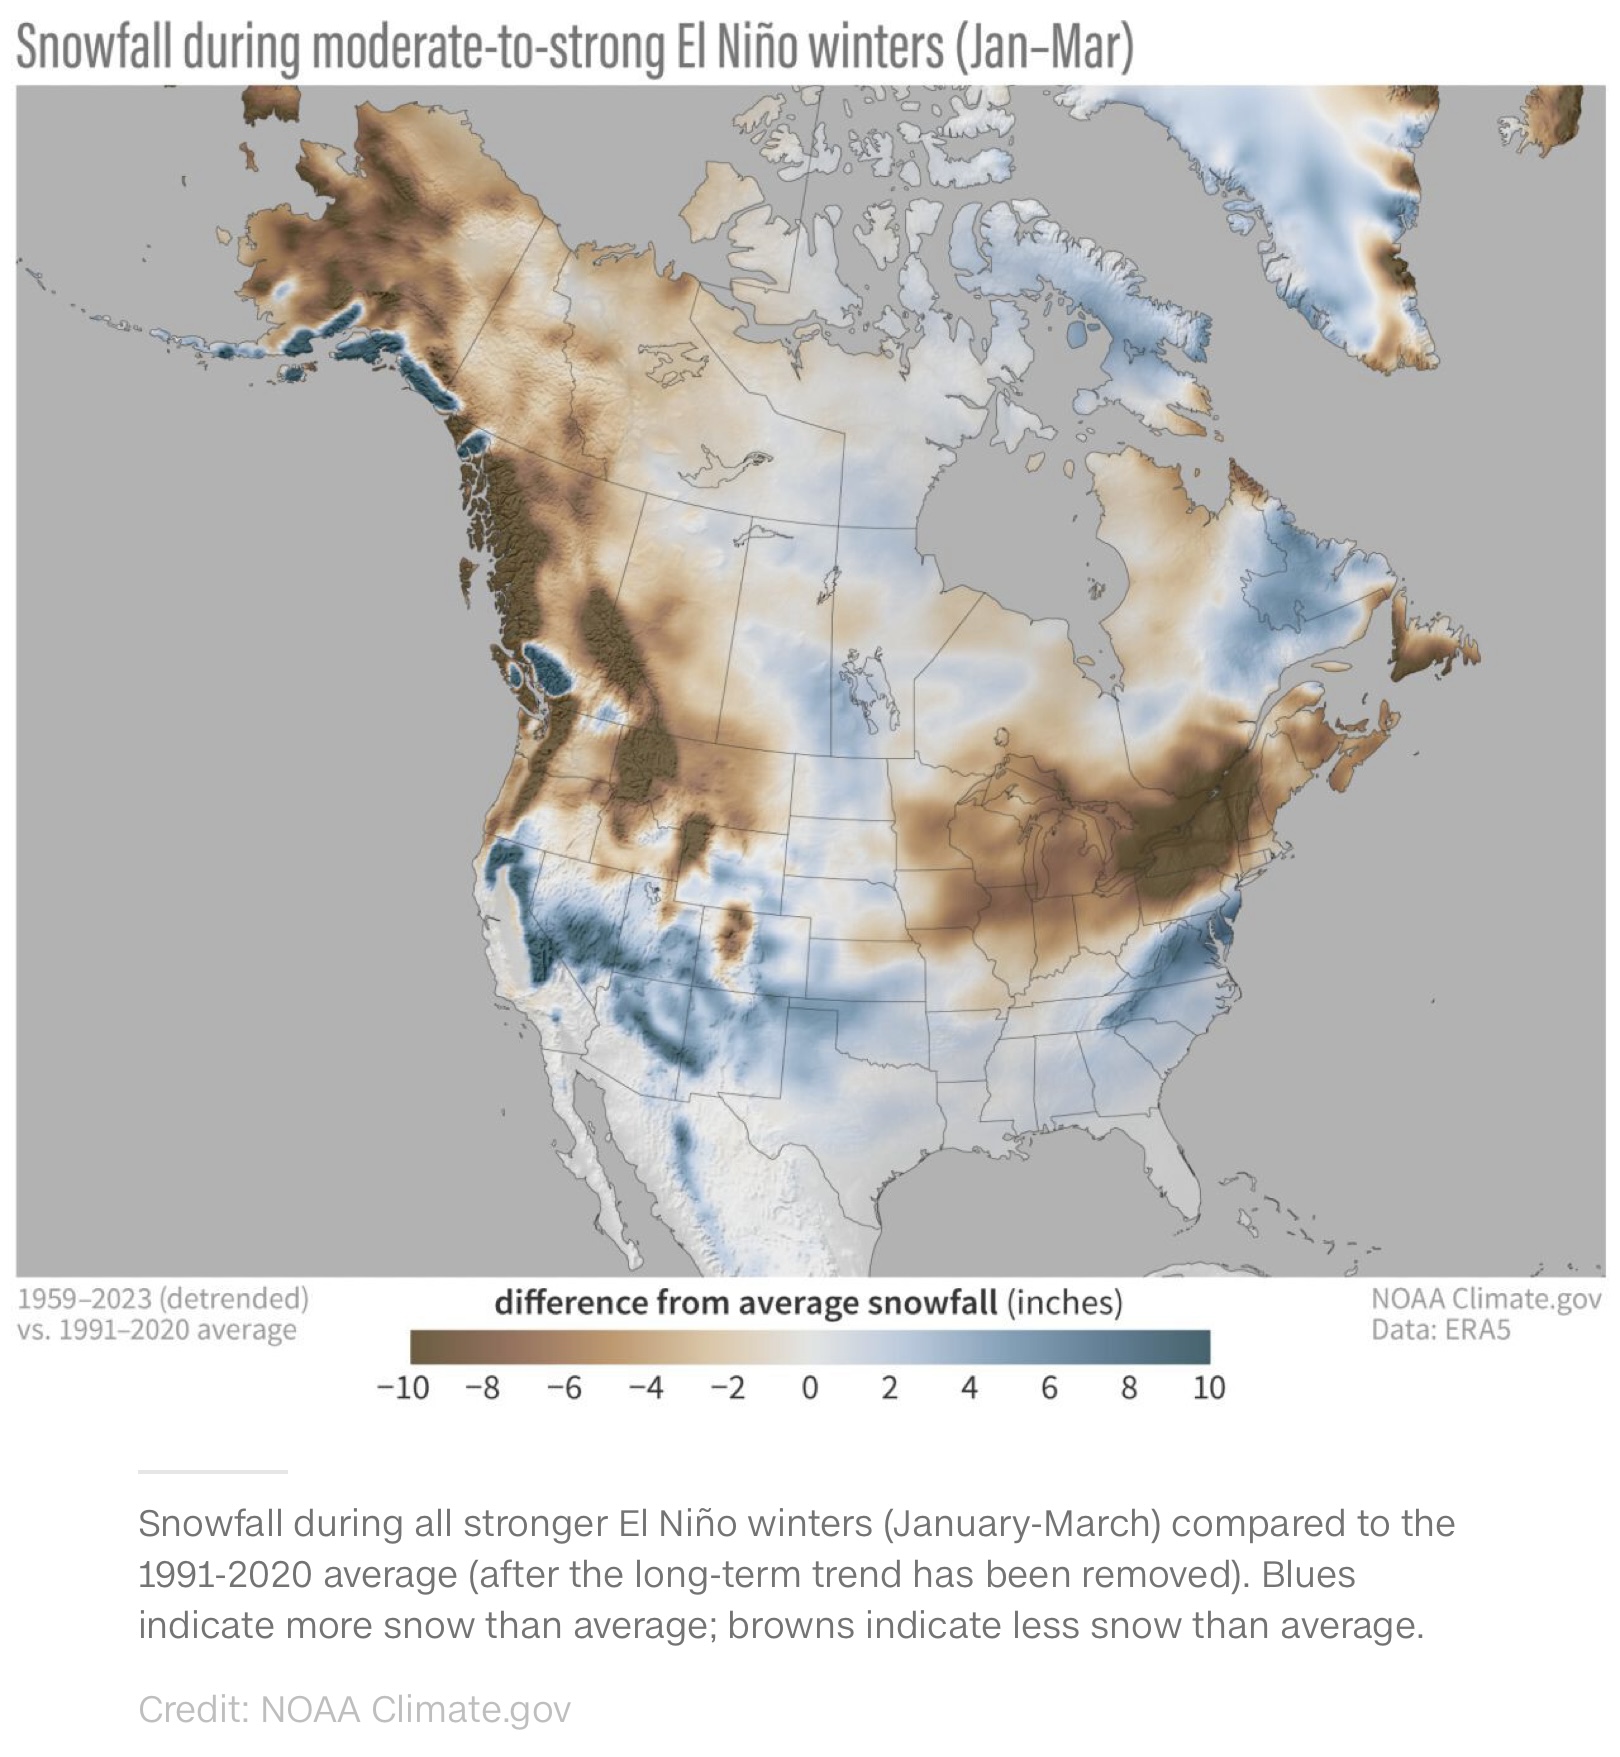
The stronger an El Niño is, the more amplified its impact becomes. The map below shows the same data for stronger El Niño winters. The pronounced darker hues represent more extreme shifts in snowfall during a strong El Niño compared to an average one.
     The big snow winners are the mid-Atlantic, the higher elevations of the Southwest and California, and the South, albeit with an important caveat. It still needs to be cold in order to snow, so chances don’t vary much from normal in portions of Texas and the Southeast, which tend to remain too warm for flakes to fly.
     El Niño’s jet stream effect is particularly noticeable in the highest terrain of the West, where cold and snow isn’t usually hard to come by. Mountains in the Southwest and California thrive while the Northwest misses out because of fewer storms.
     Storms that affect the mid-Atlantic’s snow chances typically take a track along the spine of the Appalachians or push off the coast and become Nor’easters.
     These Nor’easters can get “juiced up” by abundant tropical moisture during El Niño and deliver “two to three big snowstorms” on average, according to John Gottschalck, chief of the Operational Prediction Branch of NOAA’s Climate Prediction Center.
     This could bring above-average snowfall to places like Washington, DC, and Baltimore, MD, where less than an inch fell last winter.
     Even though the Northeast typically misses out on snow during a strong El Niño winter, all it takes is one massive storm, like a “juiced up” Nor’easter, to skew snow totals for the whole season.
     Snow lovers in the Northwest and Midwest will also have to join their Northeast counterparts in hoping for a big storm. Stronger El Niños have caused less snow than average in the past.
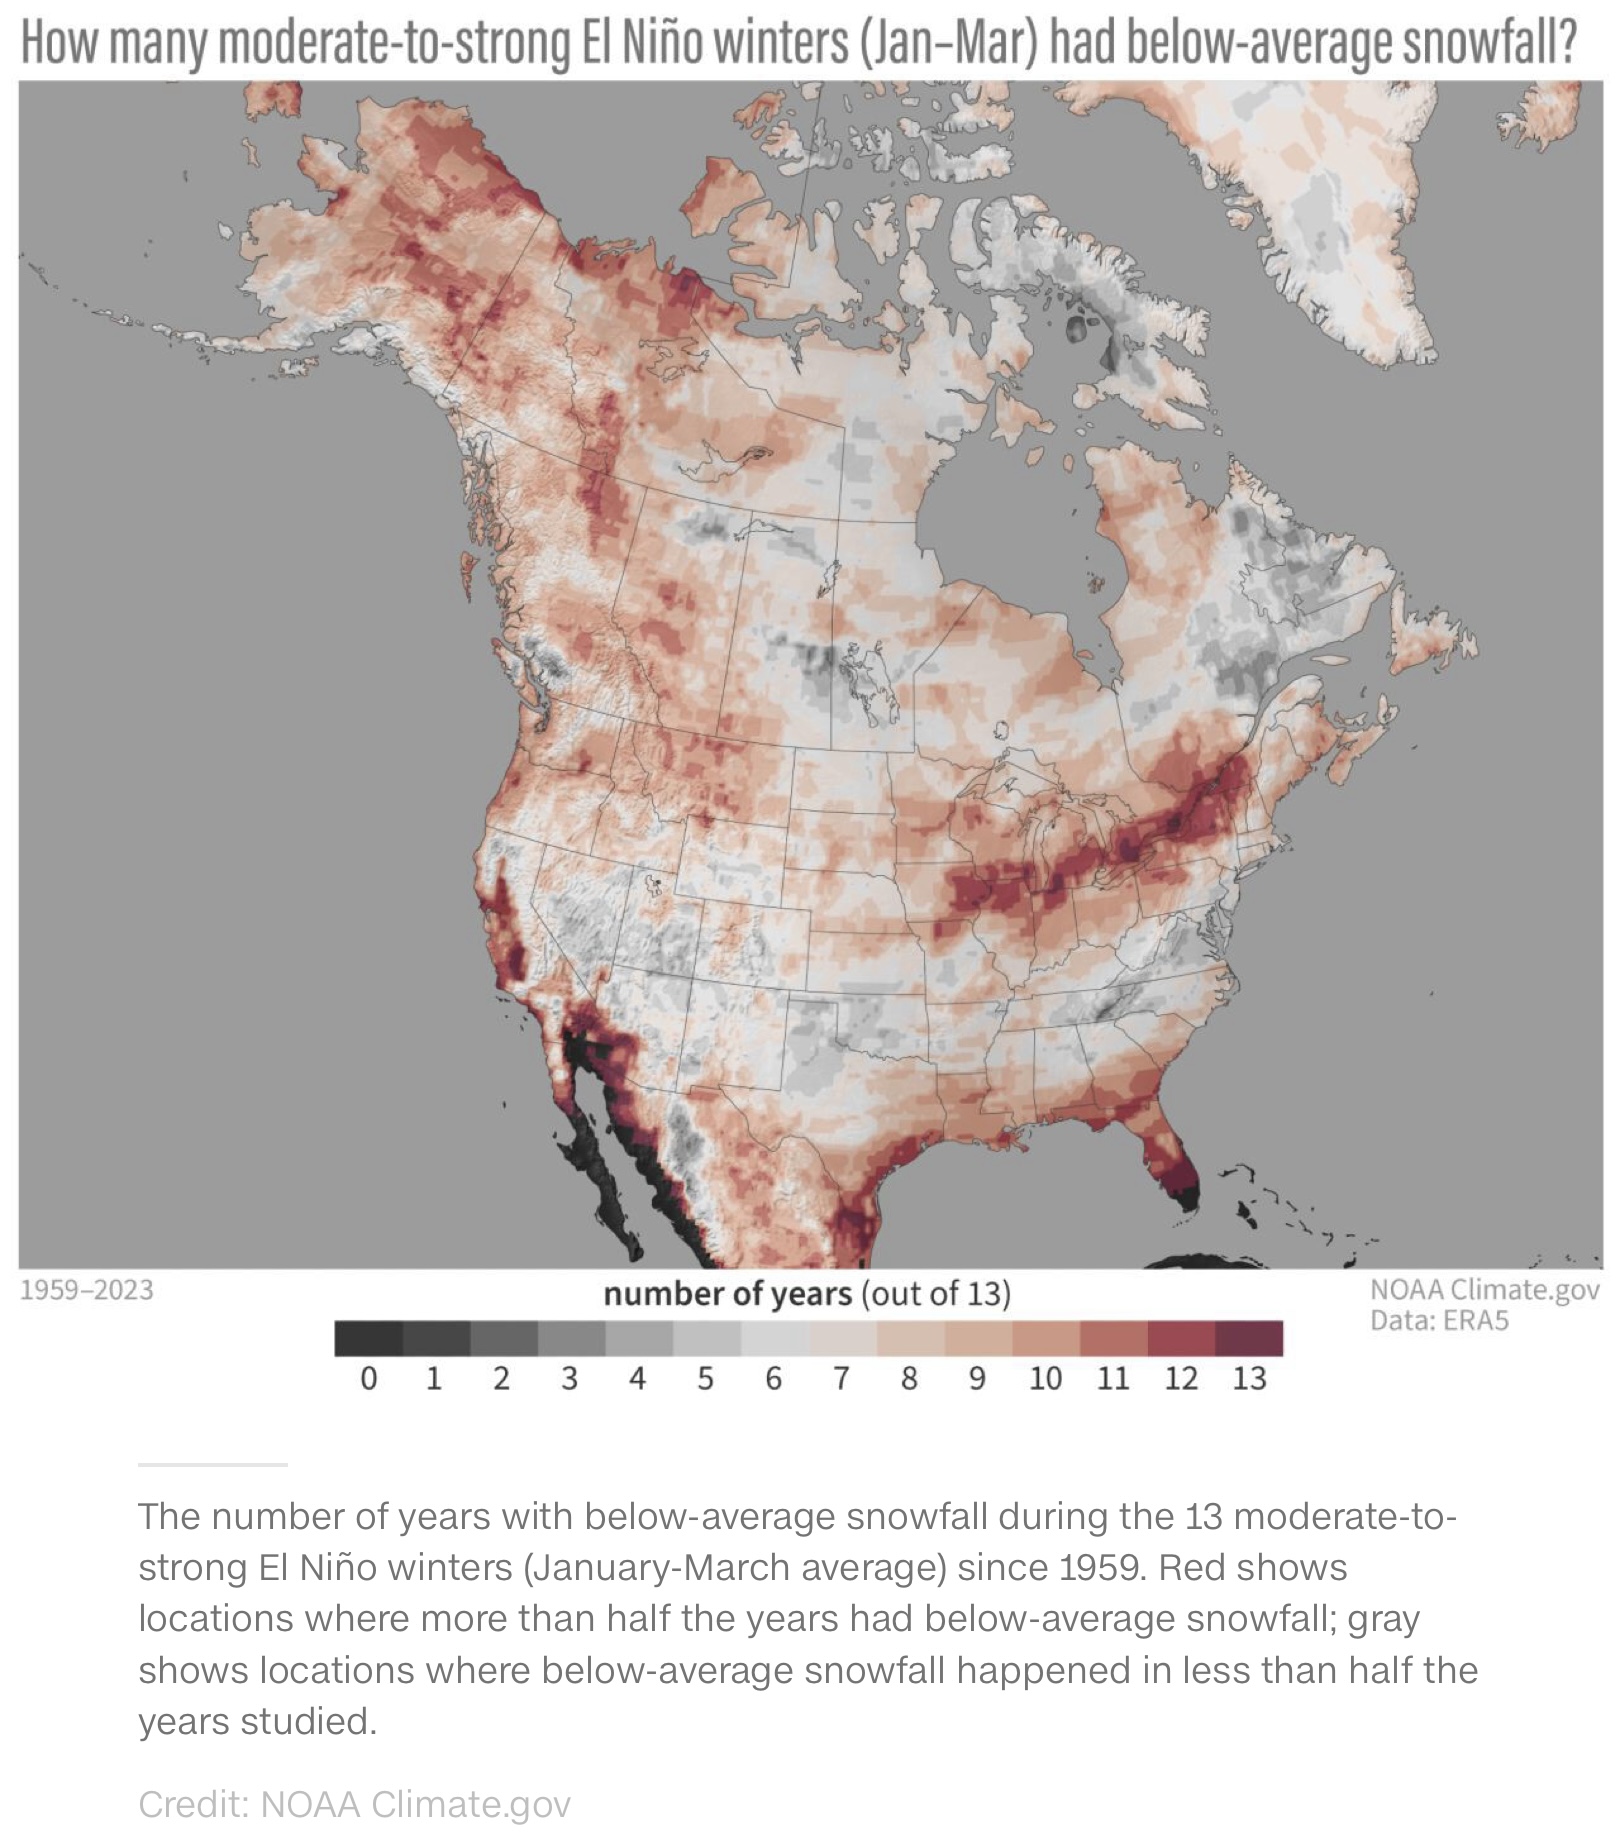
     Removing snowfall totals from the map and focusing on the number of stronger El Niños with below-average snowfall helps suss out outlier storms.
     On the map above, darker reds indicate areas that have experienced more years of below-average snowfall during moderate-to-strong El Niño winters.
     Parts of the typically snowy Midwest and Northeast which also suffer from snowfall deficits jump out clearly, a sign that this may be where El Niño steals the most snow, most often.

Sent from my iPad

 Show/hide attachments