All,
Just wanted to share with you some new graphics that I will be using, plus offering through my SPIA Index subscription service via the www.SPIA-Index.com website. We are now in the process of revising and updating our website using feedback from YOU on what you consider to be the “most wanted weather items” in updates and graphics.
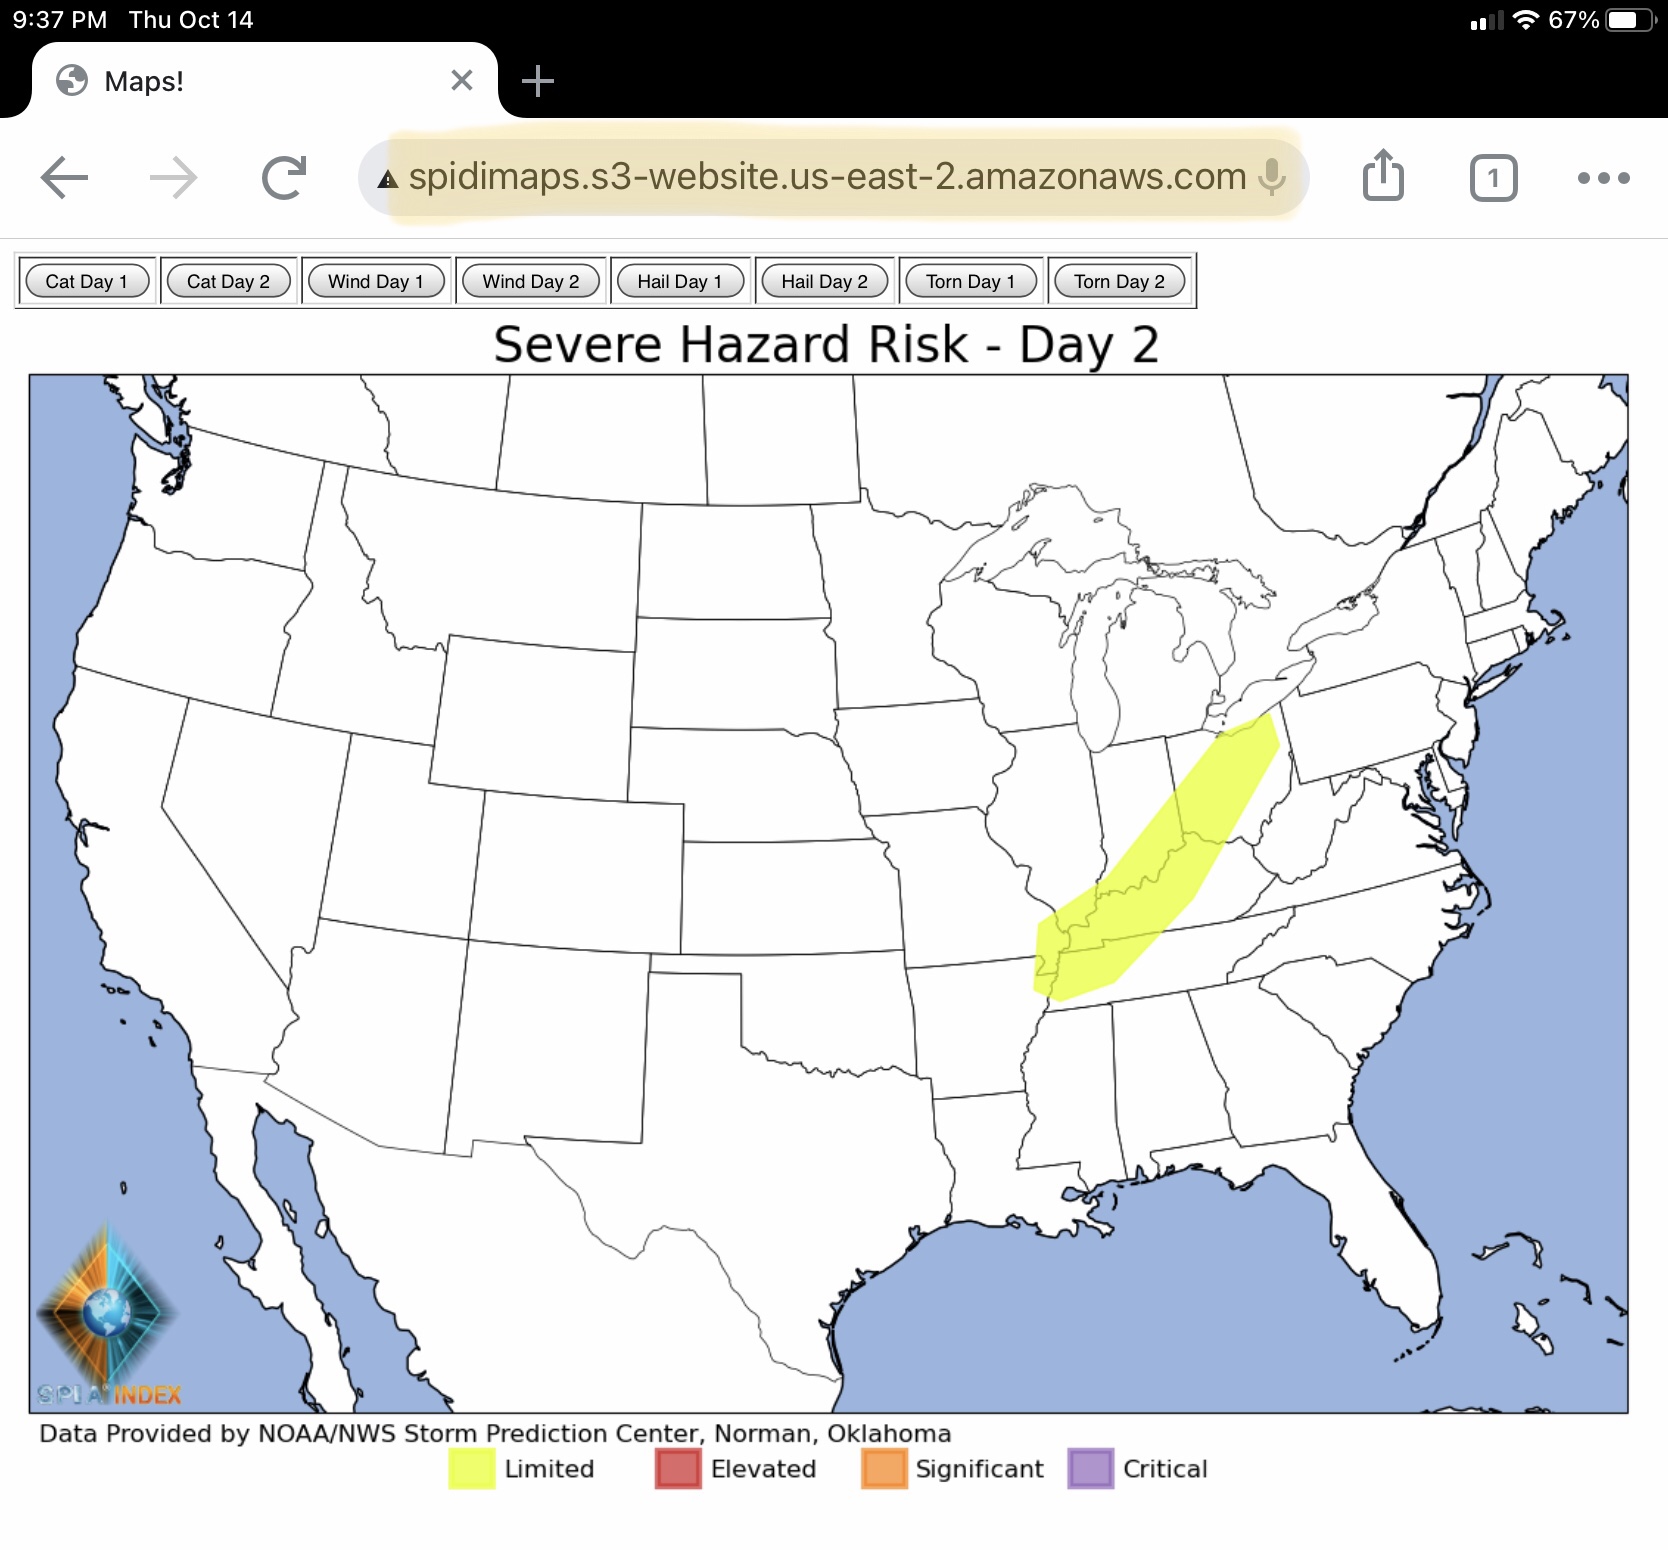
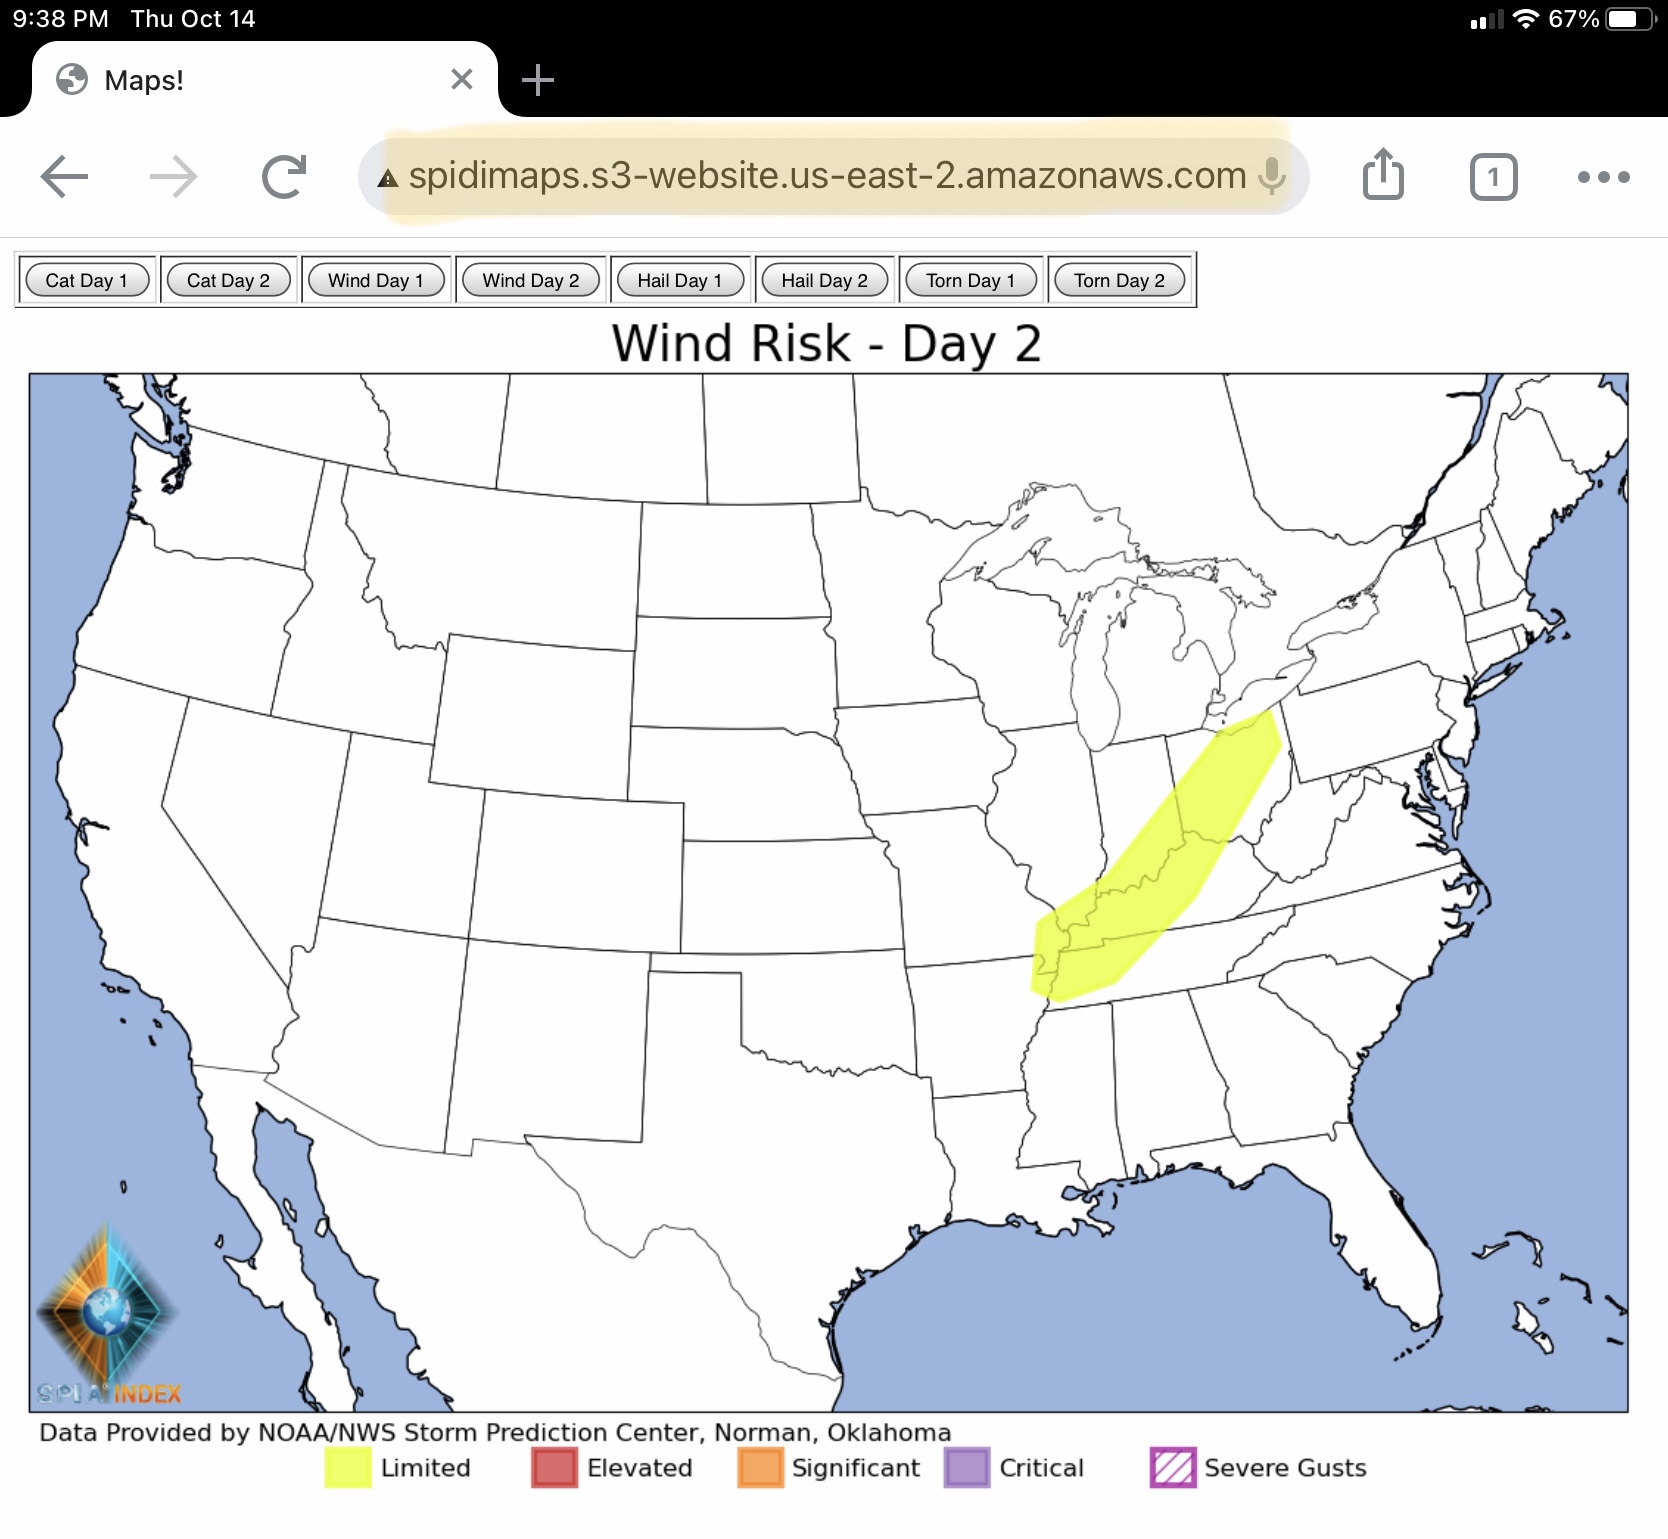
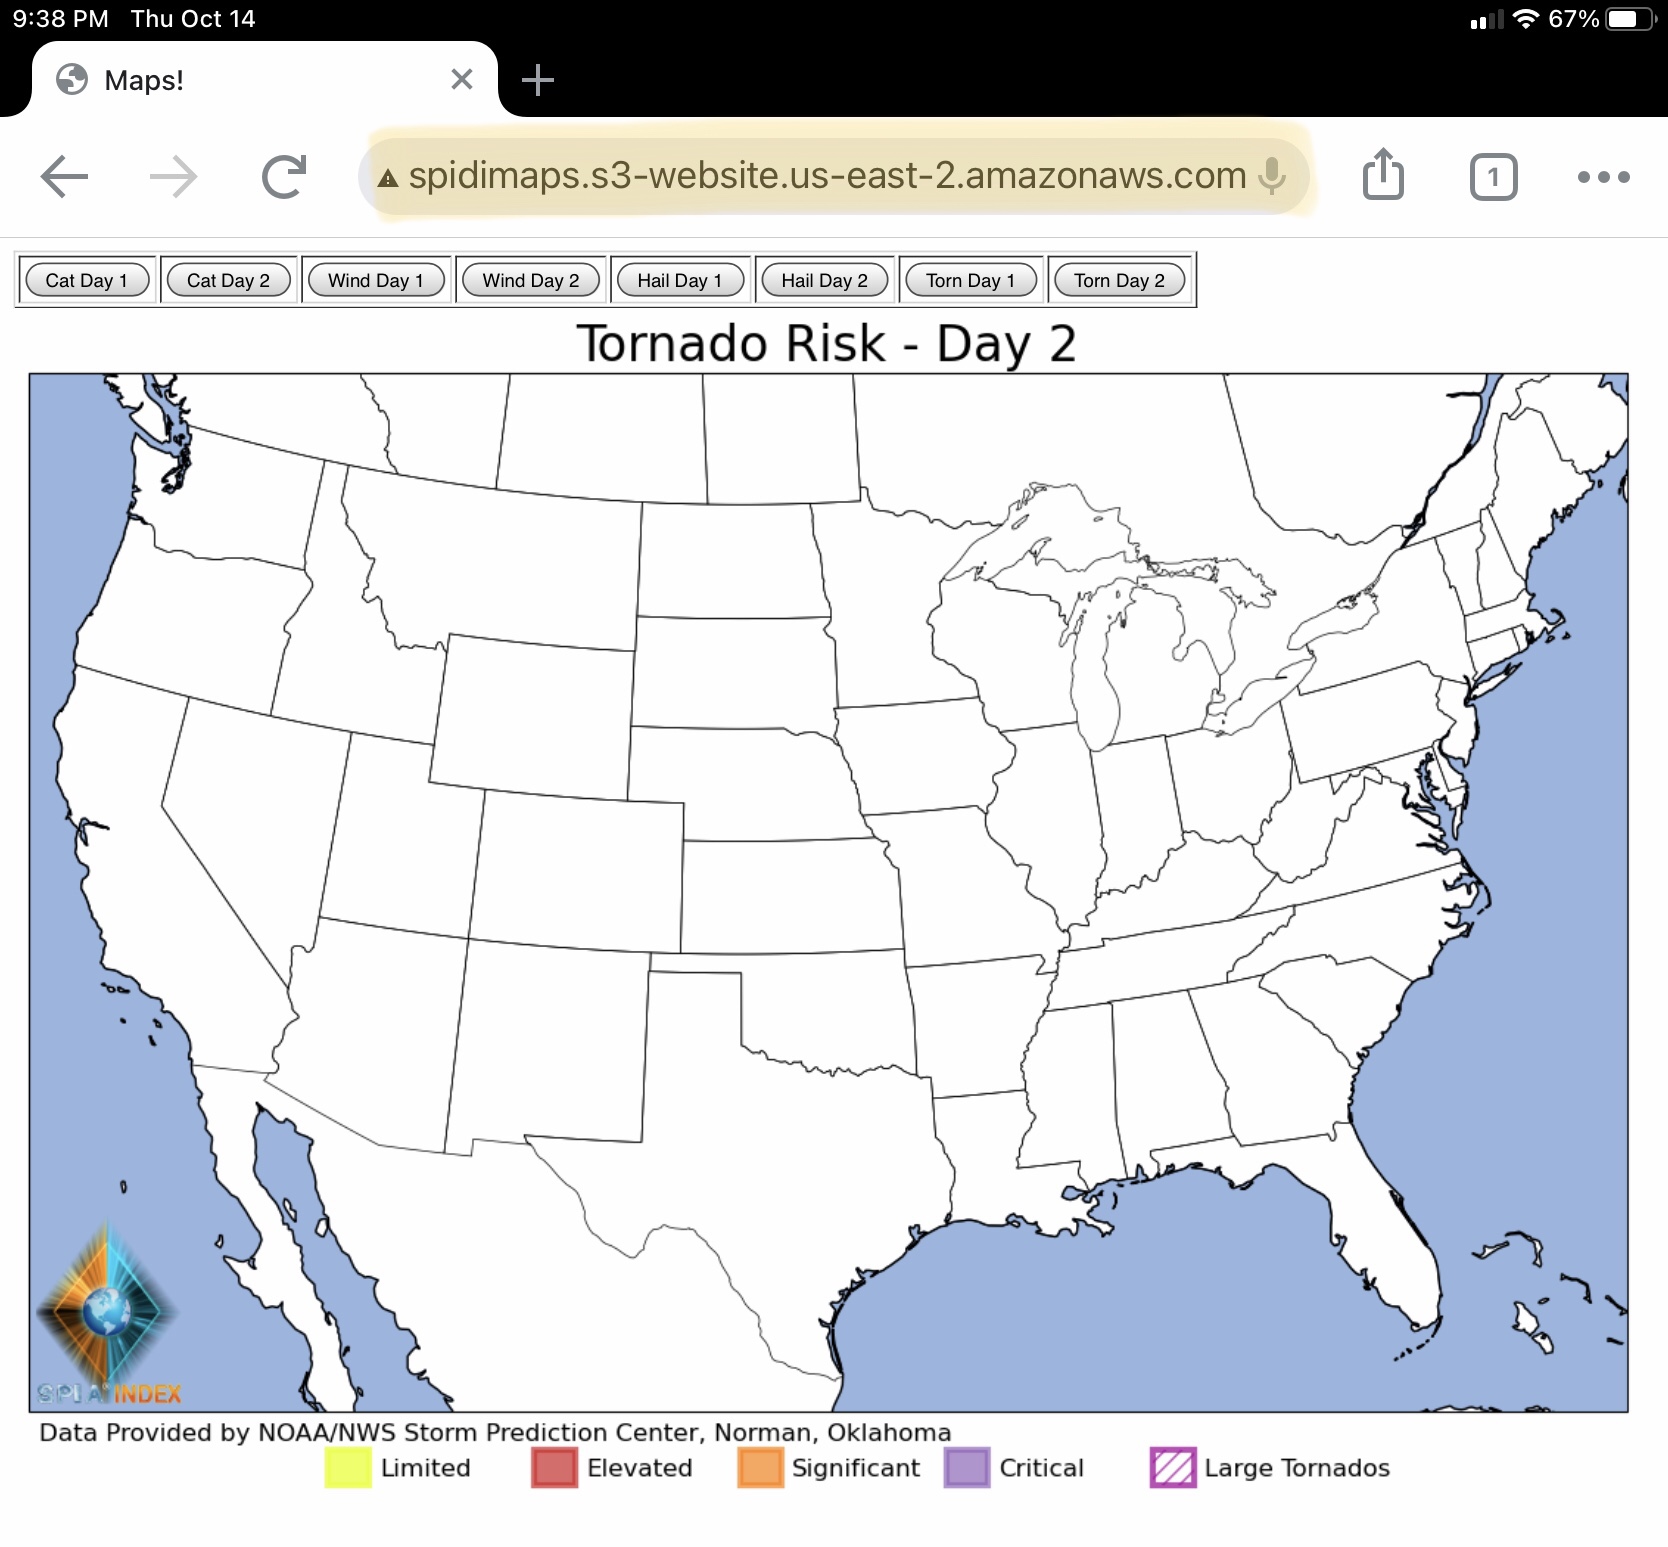
Shown below are graphics that we will create using data from NOAA, the NWS, and the Storm Prediction Center (SPC), which is based in Norman, OK. We will likely only send out updates and blog posts with these graphics for Severe Hazard Risks, Wind Risks, Hail Risks, and Tornado Risks, when conditions are “Elevated, Significant, or Critical,” and not “Limited.” However, depending on the impact threat level, we could use “Limited” in some circumstances.
When we show a “hatched area,” it will indicate the threat of severe wind gusts, extremely large hail of 2” or greater, and for large tornadoes, generally EF-2 or above.
These maps will be a part of the newly revised and updated SPIA Index website coming soon, hopefully within the next 60 to 90 days. And yes, the SPIA Index will still be the prominent feature for winter weather, but Snow & Sleet and QPF (Total Rainfall), Temps and Apparent Temps (Wind Chill and Heat Index) will also be featured, plus a new (old) humidity measurement graphic called Wet Bulb Globe Temperature, which is a better measure of humidity impact on those who work outdoors. (The U.S. Marines use it!)
Just wanted to share what’s coming in the future, and will be available via modest-priced subscriptions!
Sid Sperry
President & CEO
SPIDI Technologies, LLC
Guthrie, OK 73044
“Home of the SPIA Index Ice Impact Forecast for Electric & Communications Utilities”

 Show/hide attachments